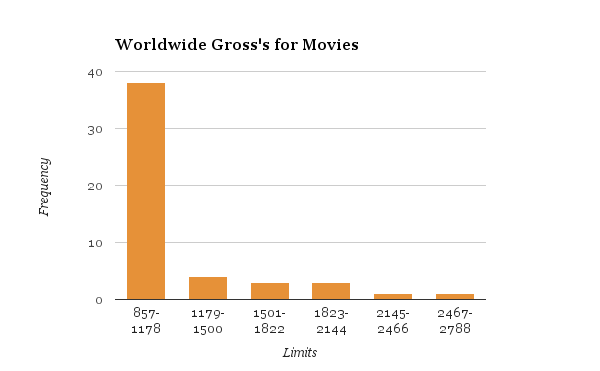
Chapter Two was mostly about organizing data, creating a frequency table, and then completing a series of graphs. The graphs that you will see in the links are: histogram, relative frequency histogram, an ogive, pareto chart, circle graph, and a time series graph. All of these graphs are made by using data in our frequency table. We picked the subject of Worldwide Grosses for Movies because it was not only interesting, but we found the top movies of all time as well. Below is our Pareto Chart.